Forecasting the Energy Demand of Planned Production Lines
A simulation model that estimates what a production line will draw from the grid before anyone has bought the machines.
Software and manuscript draft are done. The measurements on real machines and the validation against them are still ahead.
- Role
- My thesis: research questions, modelling, software and manuscript.
- Tests
- 440, all passing
- Machine families
- 6
- Sources screened
- 133
- Progress
- Phase 8.5 of 10
- Stack
- Python, SQLAlchemy, SQLite, Streamlit, Plotly, pytest
The question
Before a company builds a production line it needs to know roughly how much electricity the line will use: for the operating budget, the grid connection and the size of the electrical installation. In practice that number is usually the rated power of each machine times a utilisation someone guessed.
The problem is that consumption isn't a property of the machine type. Two milling machines can differ a lot in base load, spindle, axis drives, cooling and pumps, and the same machine draws very different power while it warms up, waits, moves its axes, changes tools or cuts. So the working hypothesis of the thesis is: the structure of the model can be general, the parameters can't. The questions that follow are how far one structure carries across machine families, what a planner needs to know at which stage, and how wrong the forecast gets when that knowledge is missing.
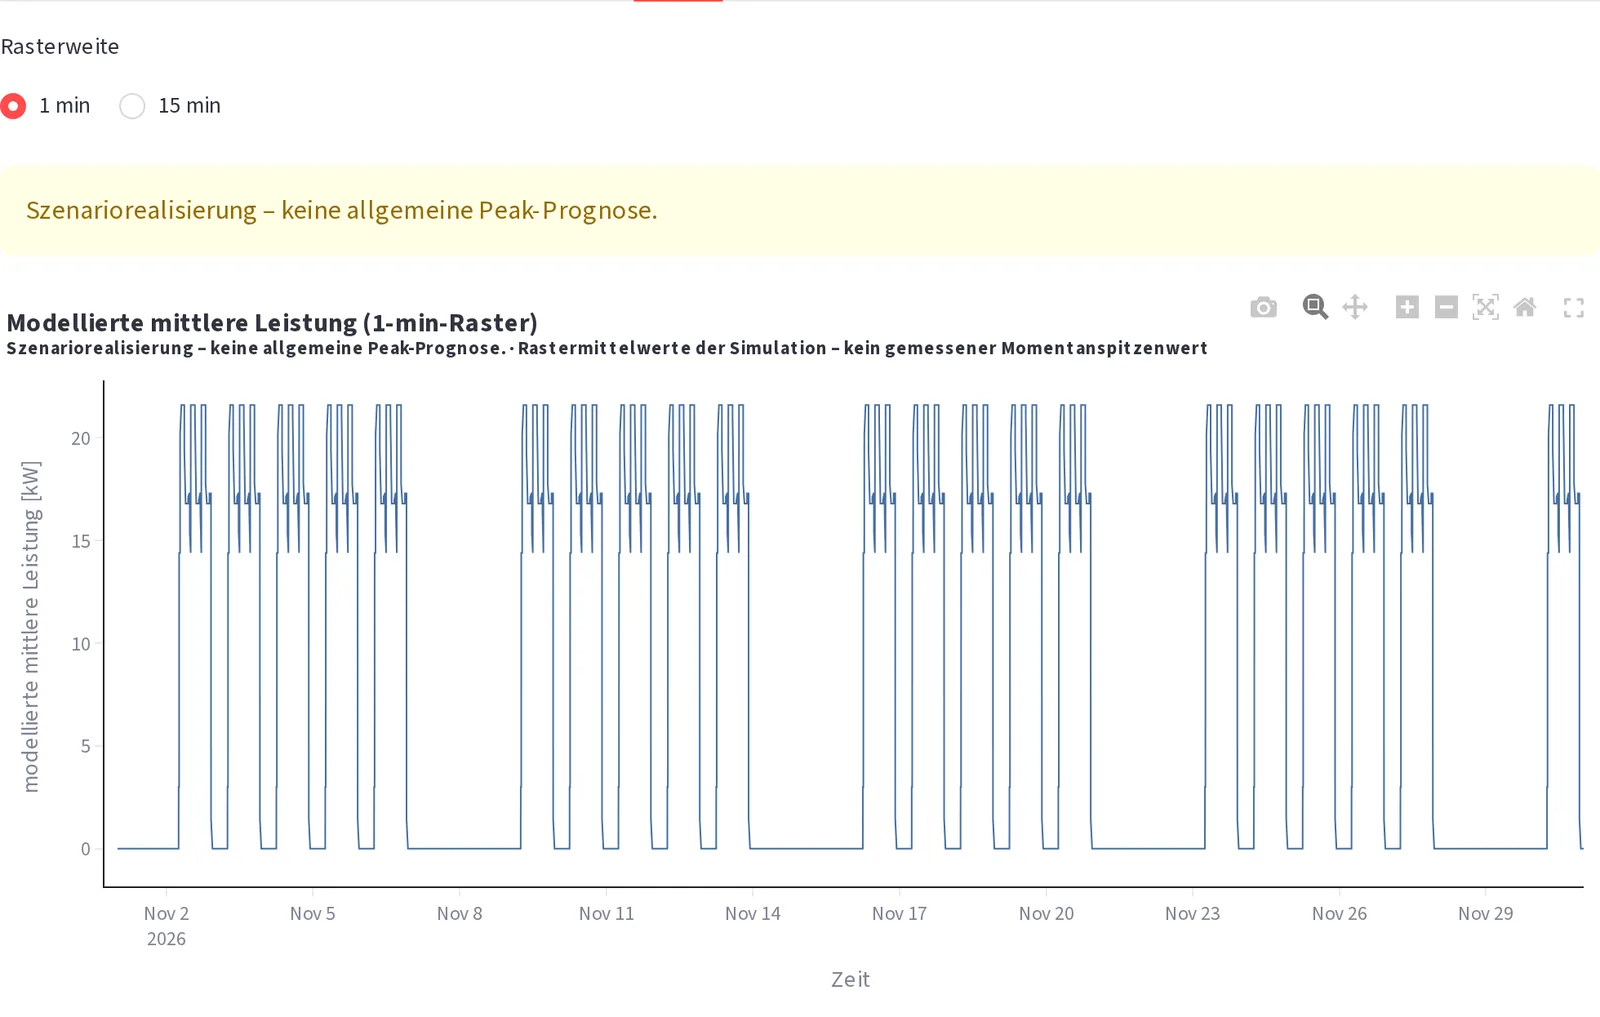
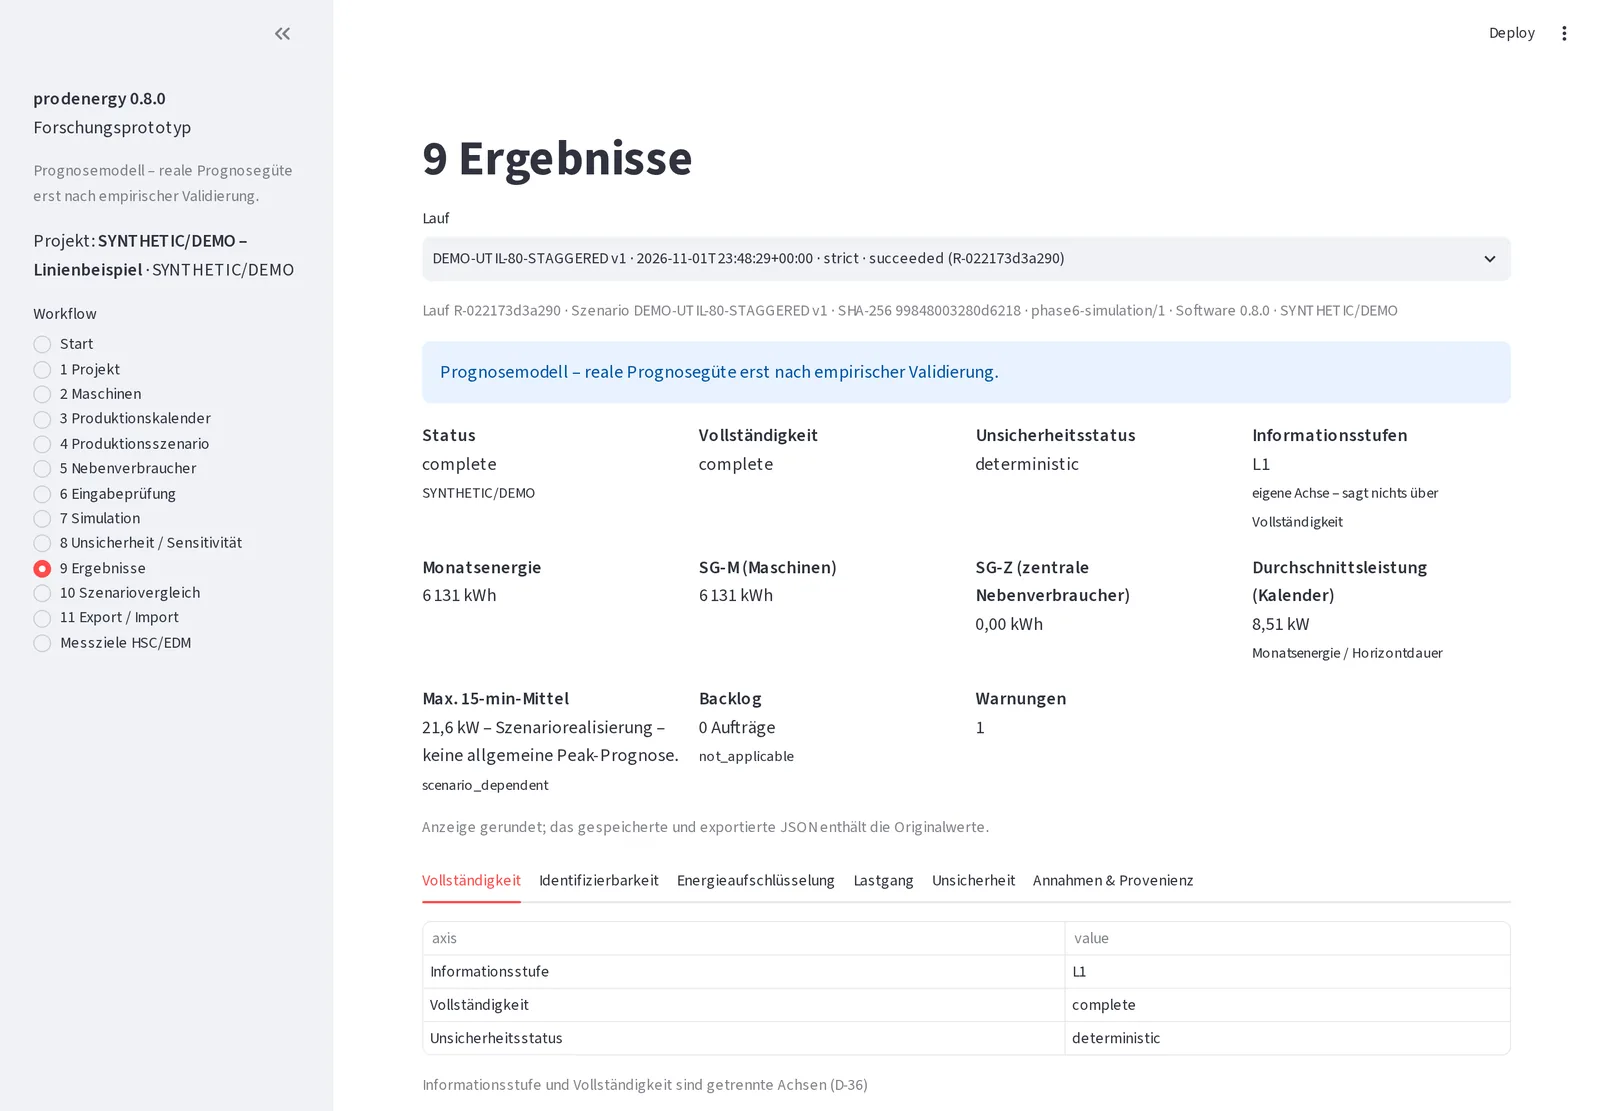
The software is called prodenergy. It runs a production simulation (which machine does what, when, in which state) and asks a machine model what each of those states costs. The output is a monthly energy balance and a load profile in 1- and 15-minute steps, with uncertainty ranges, a sensitivity analysis and a statement of how complete the result is.
Rules the model has to follow
- No silent defaults. If a parameter is missing, the result is
unknownorincomplete. The software never fills in a typical value or a median from the literature. - Every number has a source. Each parameter records where it comes from (a machine in the literature, manufacturer data, an assumption, a measurement) and at which level of knowledge: L1 structure and assumptions, L2 manufacturer data, L3 a measured machine.
- Nothing is counted twice. A measured base load already contains some auxiliary consumers. Those can't be added on top again.
- Runs are reproducible. Each run is tied to a versioned scenario schema, a hash of the scenario and hashes of the machine profiles it used.
- New machine families don't touch the core. Adding laser cutting shouldn't mean editing the scheduler.
- Peaks are labelled for what they are. At the planning stage a peak is one possible realisation of a scenario, not a peak forecast, and the UI and exports say that.
How it's put together
The most important decision was to keep the production flow and the energy physics apart. The simulator only knows states and durations. The machine packages only know what a state costs. Architecture tests hold that line: the simulator imports no machine package, machine packages never import each other, and the UI only talks to the application layer.
- Interfaces
- Streamlit UI11-step workflow
- CLIvalidate, simulate, analyze, compare, bundle
- Application
- Service layerpreflight checks, forms, view models
- WorkspaceSQLite via SQLAlchemy, versioned scenarios
- Export bundleshashed and verifiable
- Analysis
- Interval propagation
- One-at-a-time sensitivity
- Identifiability
- Measurement priorities
- Simulation
- Calendar and shifts
- Schedulergap-free segments per machine
- Central auxiliaries
- Load profileenergy-conserving raster
- Machine models
- Registry, StateRecord interface
- Milling, EDM, turning
- Laser, grinding, presses
- Core
- Units and interval arithmetic
- Calculation trace
- Literature and provenance
It's Python 3.11 with very few dependencies in the numerical core: dataclasses, enums and JSON schemas, with SQLite through SQLAlchemy for the workspace and Streamlit with Plotly for a local UI. All arithmetic is interval arithmetic on plain dataclasses, which means every intermediate value can be printed in a calculation trace when someone asks where a number came from. The literature database is JSON and TSV, built and checked by scripts, and the BibTeX for the manuscript is generated from it.
From a scenario to a load profile
- 1.
Machine models
Each machine family has its own set of states, profile format and calculator. A milling machine's power is built up per state: ready power, spindle power as a piecewise-linear or tabulated function of speed, a quadratic feed term per axis, a coolant term that can be switched off, and a cutting term. Inputs outside the measured range raise an error unless extrapolation is explicitly allowed.
- 2.
Scenario and calendar
A scenario (
production-scenario/1) sets the time horizon, shift windows, machine instances and shift policies, and exactly one of two modes: order-driven (orders, routings, operations) or utilisation-driven (time share per state). - 3.
Scheduler
Operations turn into state records on a gap-free timeline per machine. Setup happens once per operation, cycles once per part, and nothing is split across a shift or horizon boundary. The scheduler is deterministic, so the same scenario gives the same timeline every time.
- 4.
Energy
Each segment asks its machine adapter for energy (
energy_model_for(profile).compute_energy(...), cached per profile, state, duration and parameters). Central systems such as compressed air are calculated from when they're needed and booked to their own system boundary. - 5.
Load profile
Segment powers are rasterised to 1- and 15-minute means from the exact overlap with each interval, so no energy is lost or gained. The result lists energy per system boundary, a breakdown, the order backlog, how complete it is, and the full provenance.
Three ideas the model depends on
E = Σ_stationary P(s_j) · Δt_j + Σ_events n_j · E_ev(s_j)Inclusion instead of guesswork. A measured ready power is an aggregate, and it declares which components it already contains. An extra component can only be added if it's provably not in there: either the list is declared complete, or the component is explicitly excluded. Otherwise the calculator raises DoubleCountingError or AmbiguousInclusionError rather than return a number that might be wrong.
Ranges, not point values. Parameters can be intervals, and the intervals carry through every sum and product. An unknown input makes everything that depends on it unknown. Completeness and level of knowledge are tracked separately: a measured machine (L3) is still incomplete if one of the states the scenario needs was never measured.
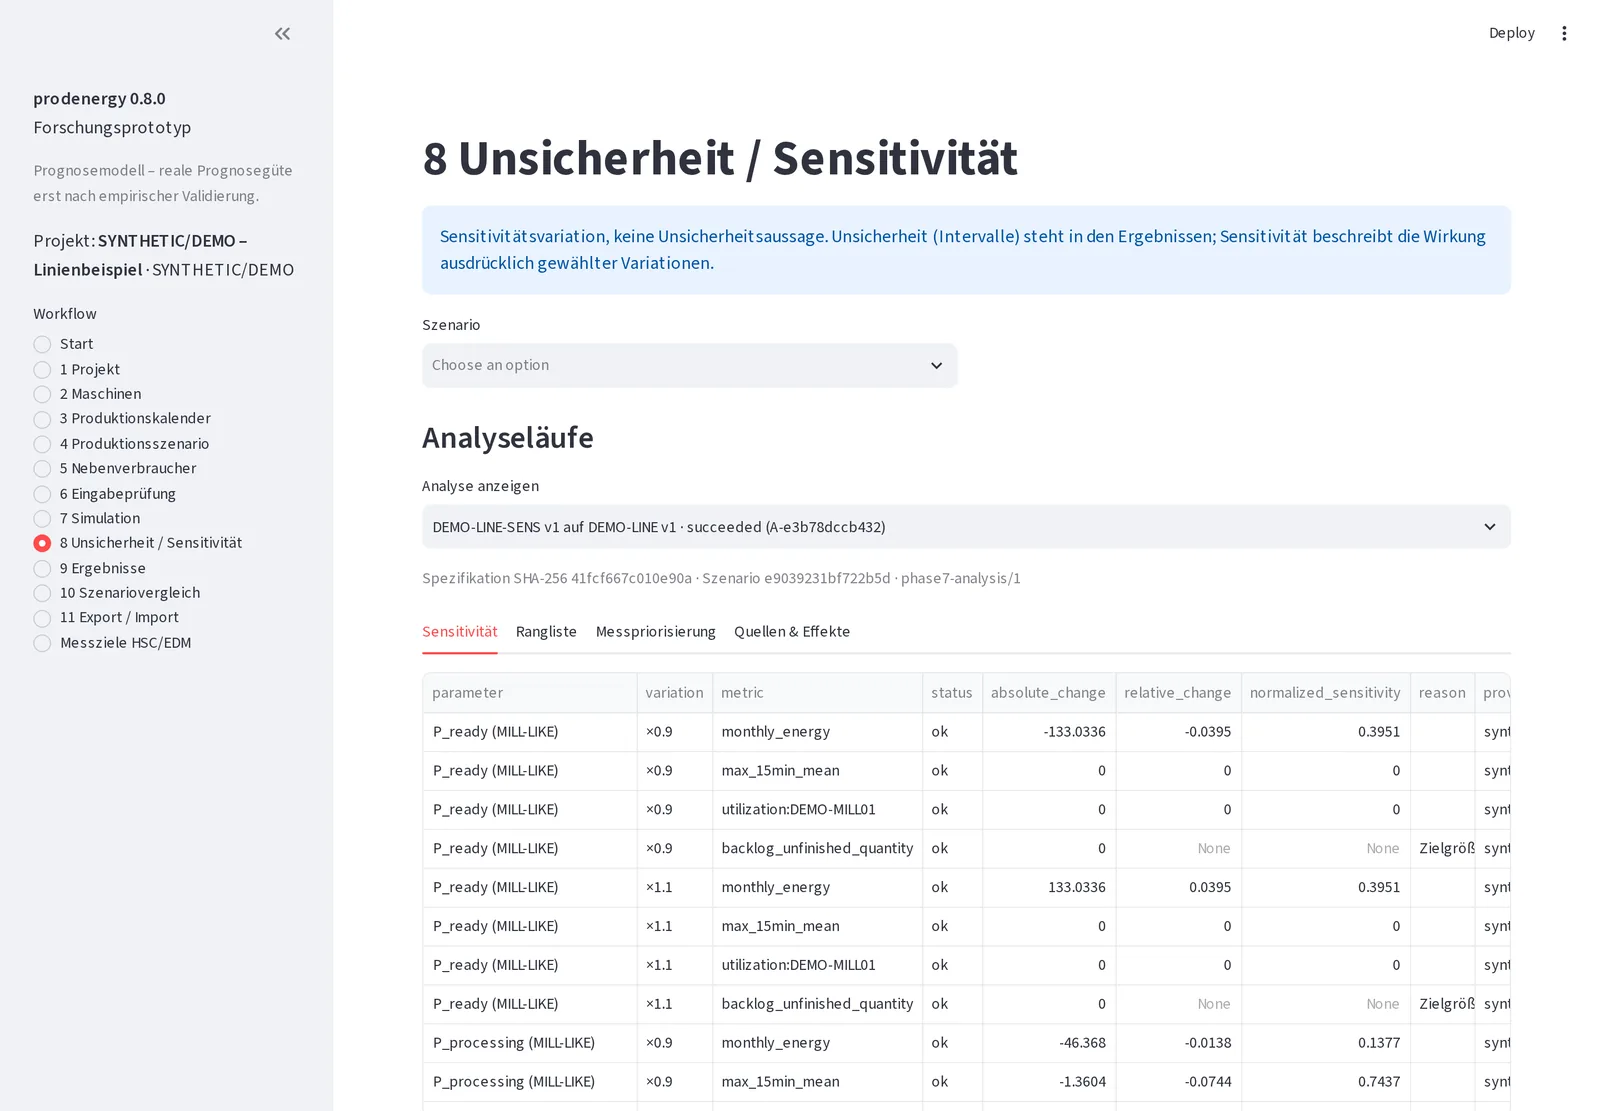
Knowing what to measure next. One-at-a-time variations along explicit parameter paths give normalised sensitivities and a ranking. An identifiability check then asks whether a parameter could be determined from the planned measurements at all. Together they say which measurement is worth the most.
Where it was hard
- The published data doesn't line up. Measurements in papers use different system boundaries and rarely say what a base load includes. The literature base has 133 screened sources and 30 independent data lineages, and a parameter only counts as supported once there are at least three comparable measurement campaigns behind it.
- Six machine families, one scheduler. Spindles, EDM generators, laser sources, hydraulics and grinding wheels all have different states, and they all had to plug into a scheduler that knows none of them.
- Refactoring without moving a single number. When EDM was added, the shared model kernel was pulled out of the milling package. The milling profiles were regenerated byte for byte and the example outputs didn't change.
- Making `unknown` work everywhere. In arithmetic, results, UI and exports. It's more work than computing a number, but it's the whole point of the model.
Decisions and what they cost
A deterministic segment scheduler instead of a discrete-event framework
- Why
- Planning scenarios are fully specified. Determinism makes runs reproducible and testable byte for byte.
- Cost
- No random process times or breakdowns yet.
Interval propagation instead of Monte Carlo
- Why
- Without measured distributions, sampling from made-up ones would only look precise.
- Cost
- Intervals can get wide.
Streamlit on top of a strict service layer
- Why
- A quick local UI for planners and examiners, while all the logic stays in the package and under test.
- Cost
- A single-user local tool, not a web service.
No common base class for machine models
- Why
- The families share functions and data types, not a hierarchy. One universal model would hide differences that matter.
- Cost
- Some repeated structure across packages.
Where it stands
Phases 1 to 8.5 of 10 are done: literature base, machine models, simulation, analysis, application and UI, and a draft of the manuscript. What works today is the whole chain from machine profiles to a monthly energy balance and load profile, with uncertainty and sensitivity analysis, scenario comparison, reproducible export bundles and a local UI with a synthetic demo project.
- Tests
- 440, all passing
- Machine families
- Milling, sinker EDM, turning, laser cutting, grinding, presses
- Literature base
- 133 screened sources, 39 source machines, 110 source measurements
- Manuscript
- Chapters 1 to 11 drafted, results chapters pending
After phase 10 (evaluation and the final manuscript), the obvious extensions are random process times, measured distributions instead of intervals, and a multi-user web interface.